
Capnography and evidence of circulation
Read the draft explanation
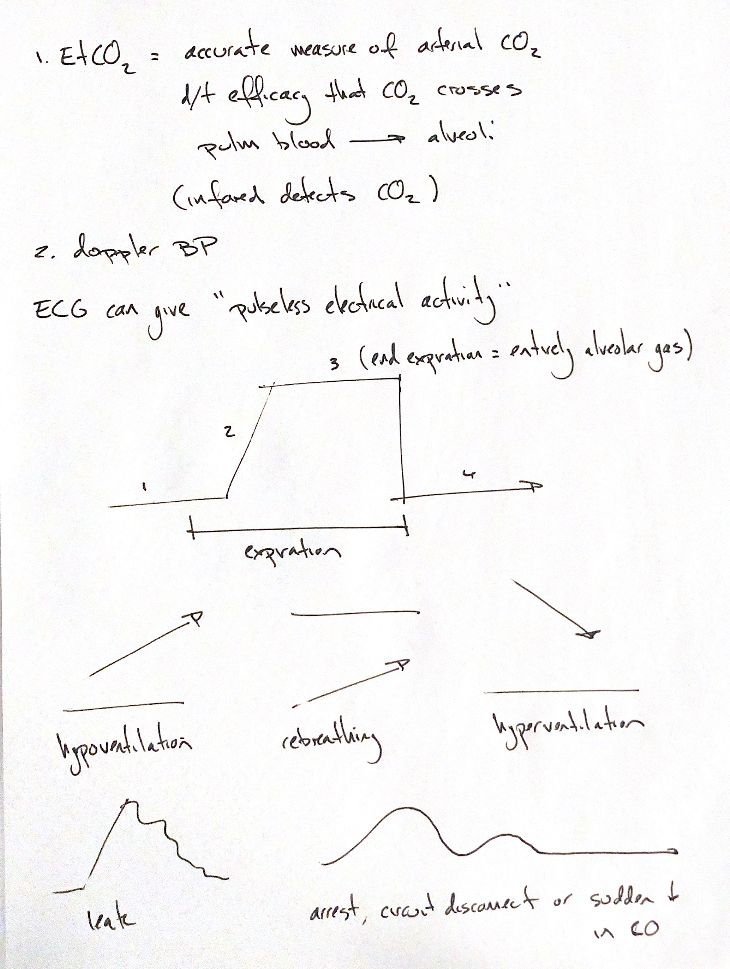
An ECG shows electrical activity. It can still look organised when there is no pulse. That is pulseless electrical activity, or PEA. My notes pair EtCO2 and Doppler blood pressure as practical clues to circulation. Neither directly measures cardiac output. Blood pressure also depends on vascular resistance.
Pulmonary blood flow brings CO2 to the alveoli. At the end of expiration, exhaled gas is largely alveolar gas. A capnograph detects that CO2 using infrared light. EtCO2 can estimate arterial CO2, or PaCO2, especially when lung function is normal. My 3–6 mmHg lower cue is approximate. The gap can change with perfusion, ventilation–perfusion mismatch and sampling. It is not a fixed correction.
The four numbers follow my original normal sketch. Expired dead-space gas starts low. CO2 rises as mixed gas passes the sensor, then reaches the alveolar plateau. EtCO2 is sampled at the end of expiration. Inspiration brings the trace back toward zero.
The three small arrow sketches show different trends. Hypoventilation raises the plateau. Rebreathing raises the baseline, which fails to return toward zero. Hyperventilation lowers the plateau. These are trend cues, not complete waveforms or diagnoses on their own.
A leak may make the plateau fall early. A falling or absent EtCO2 signal may also occur with cardiac arrest, a disconnected circuit or a sudden drop in cardiac output. The trace alone cannot separate these causes. The patient, airway, circuit and sampling all need assessment.
References
Johnston & Tobias, 2nd ed., Chapter 21; Teixeira Neto et al. 2002; Hightower et al. 1980; Wagner & Gaynor 1998; RECOVER 2024 (PEA/capnography definitions).