
Oxygen delivery, extraction and the critical-delivery threshold
Read the draft explanation
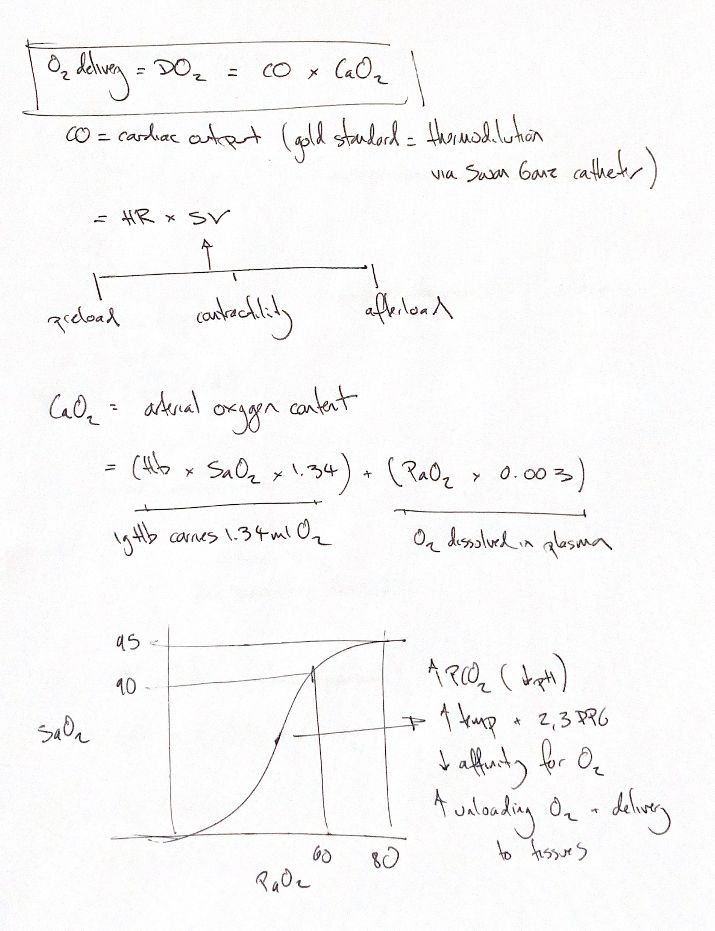
Oxygen delivery is the oxygen carried to tissues each minute. It equals cardiac output times arterial oxygen content. Cardiac output is heart rate times stroke volume. Preload, contractility and afterload shape stroke volume. Thermodilution through a Swan–Ganz pulmonary artery catheter is the classic reference method in these notes.
Most oxygen rides on haemoglobin. CaO₂ = (Hb × SaO₂ × 1.34) + (PaO₂ × 0.003). Use Hb in g/dL, PaO₂ in mmHg and saturation as a fraction, so 95% becomes 0.95. This gives mL O₂/dL. Fully saturated Hb carries about 1.34 mL O₂/g; the smaller term is dissolved oxygen, using the coefficient at 37°C. With cardiac output in L/min, multiply by 10 to get delivery in mL/min. The same conversion applies to the Fick equation.
The original curve marks roughly 90% saturation at 60 mmHg and 95% at 80 mmHg. These are recall guides, not a calibrated canine curve. Higher CO₂, lower pH, higher temperature and more 2,3-DPG shift it right. Haemoglobin holds oxygen less tightly, which helps unloading at the tissues.
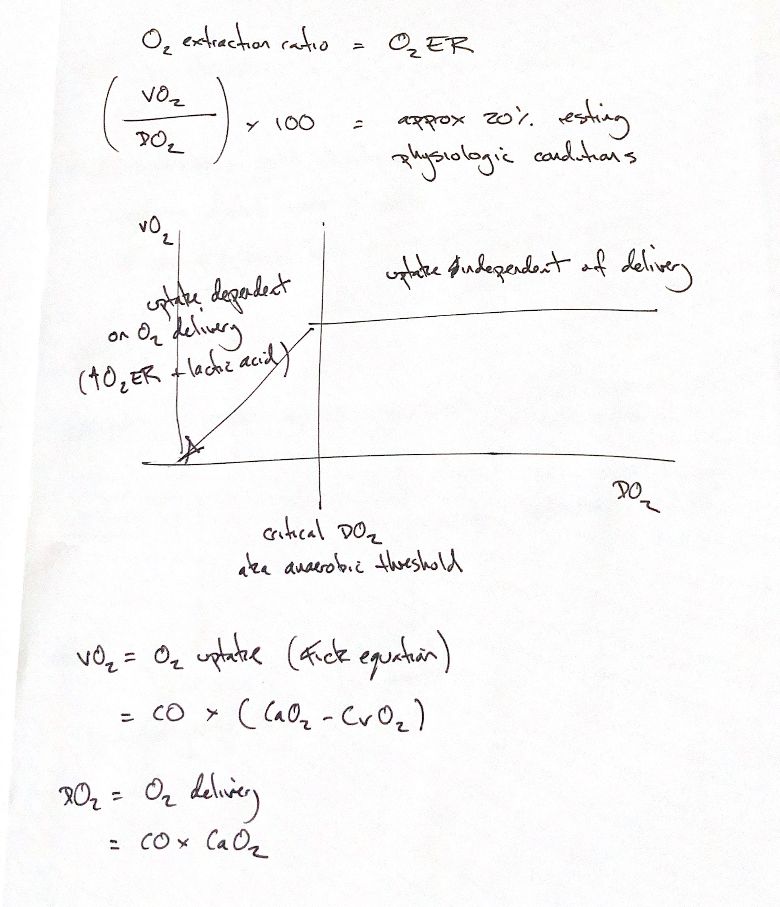
O₂ extraction is the fraction of delivered oxygen that tissues take up: VO₂/DO₂ × 100. It is about 20% globally in resting dogs; a study of 97 instrumented, unsedated, normovolaemic dogs found 20.5%. Each organ and clinical state can differ. Fick gives uptake as CO × (CaO₂ − CvO₂), using mixed venous oxygen content.
As delivery falls, tissues first extract more and keep uptake fairly steady. Below critical delivery, extraction cannot meet aerobic demand and uptake falls with supply. This is the anaerobic-threshold cue in the drawing. Lactate may rise, but it also depends on clearance and other causes. The threshold varies; the graph gives no universal treatment cutoff.
References
Johnston & Tobias, Veterinary Surgery: Small Animal, 2nd ed., Ch. 6; Haskins et al., Comp Med 2005;55:156–161; Nelson et al., J Appl Physiol 1987;63:387–394.